
Energy · Web & mobile
Shared Solar
A research-led dashboard and report experience that helped households understand where their energy came from—and what to do next.
01
Overview
With more than 20,000 sites Australia-wide, Solar Analytics is Australia’s largest independent third-party solar and energy monitoring provider.
Solar Analytics wanted to help their customers even more and push the boundaries even further. I was part of a very ambitious project to give everyone, every household, more control over their energy.
The team was composed of the product owner, product manager, data scientist, a developer and myself.
02
Kickoff
I do not seek. I find.
Before I joined Solar Analytics, they had done a couple of rounds of heuristic research. With this research foundation laid, I continued with deeper research into how people use their energy, their knowledge about energy in general and what their main pain points are.
1-1 Interview
My role here was to write the interview script and interview 20 participants. After getting sign-off on the interview script, I started to look for participants. At this stage, I had 2 options: use an external company like Askable, or use 2 big mailing lists that Solar Analytics had. Plan C was to use Solar Analytics’ Facebook database. The participants we were looking for didn’t need to meet specific criteria, besides some of them having photovoltaics and some without.
Over a period of 2 weeks, I booked the participants and interviewed them via phone or Zoom, depending on their availability and technical skill with computers.
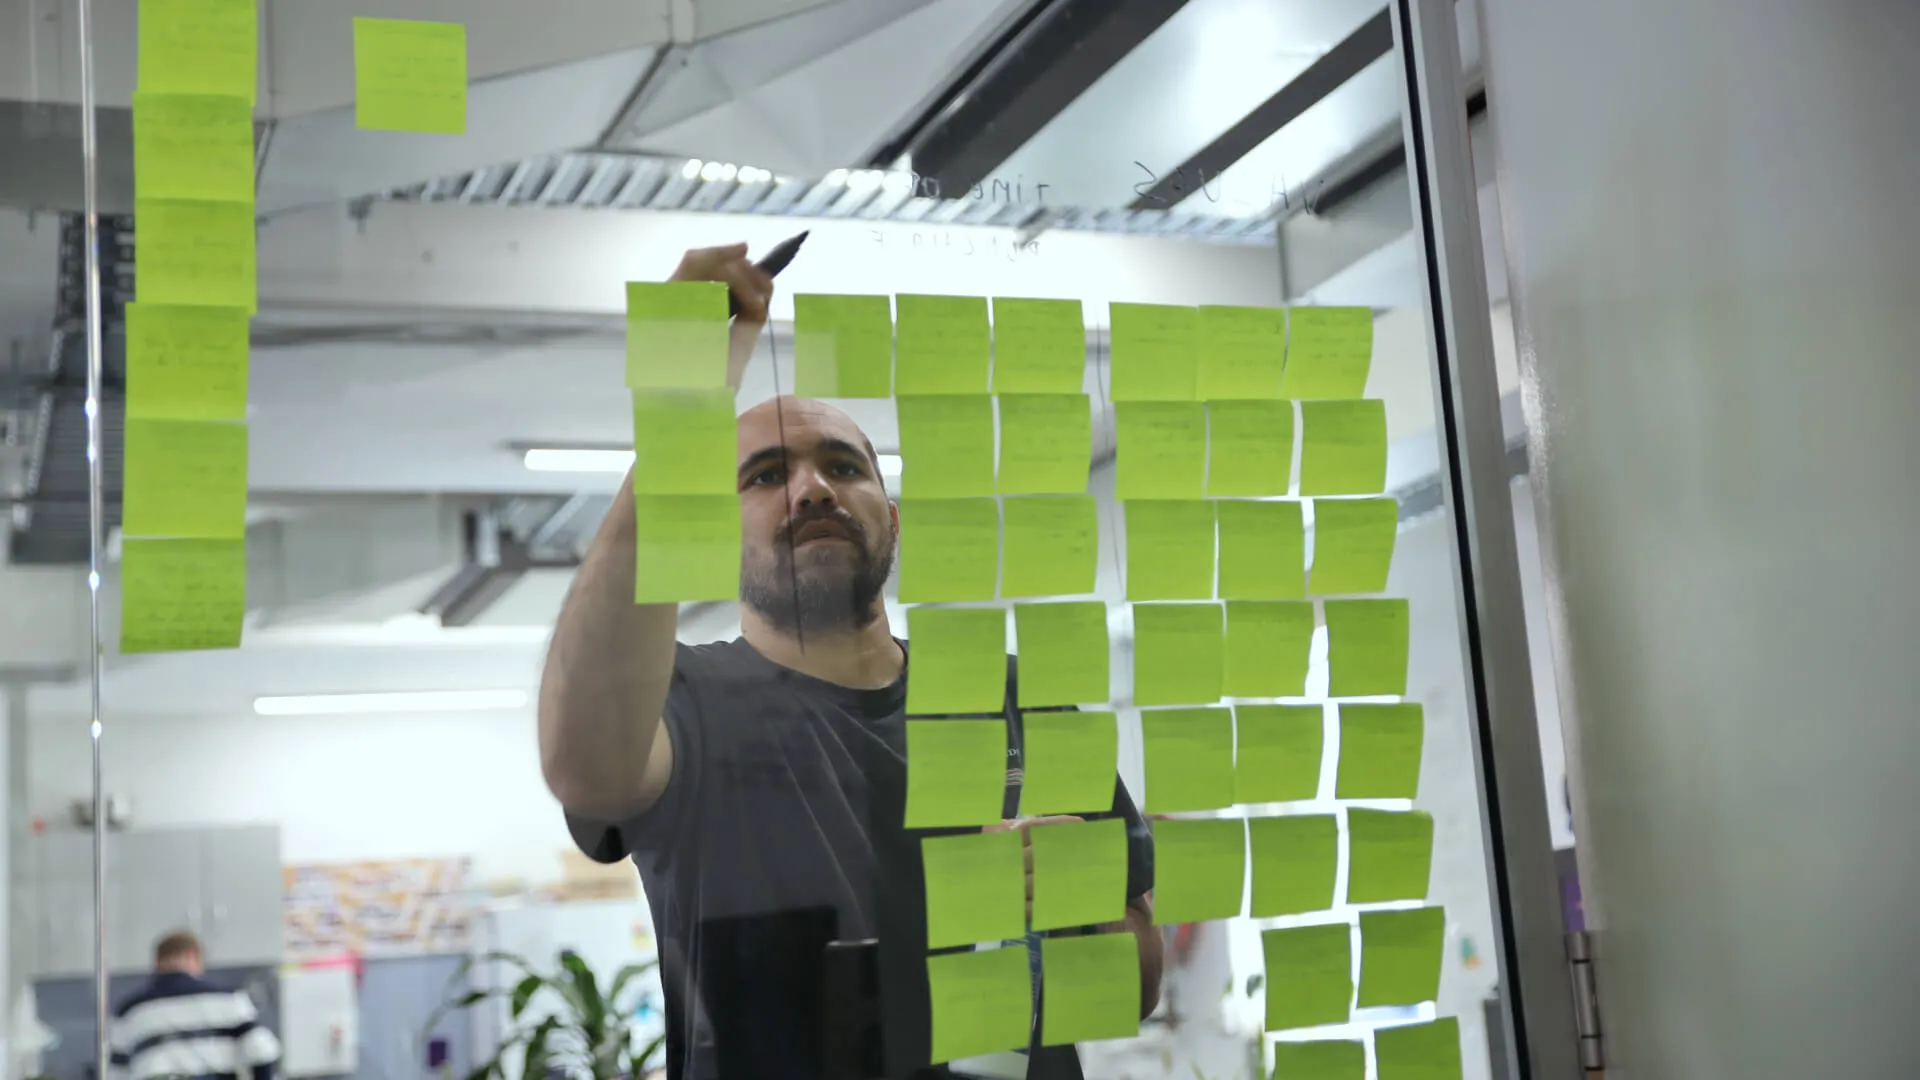
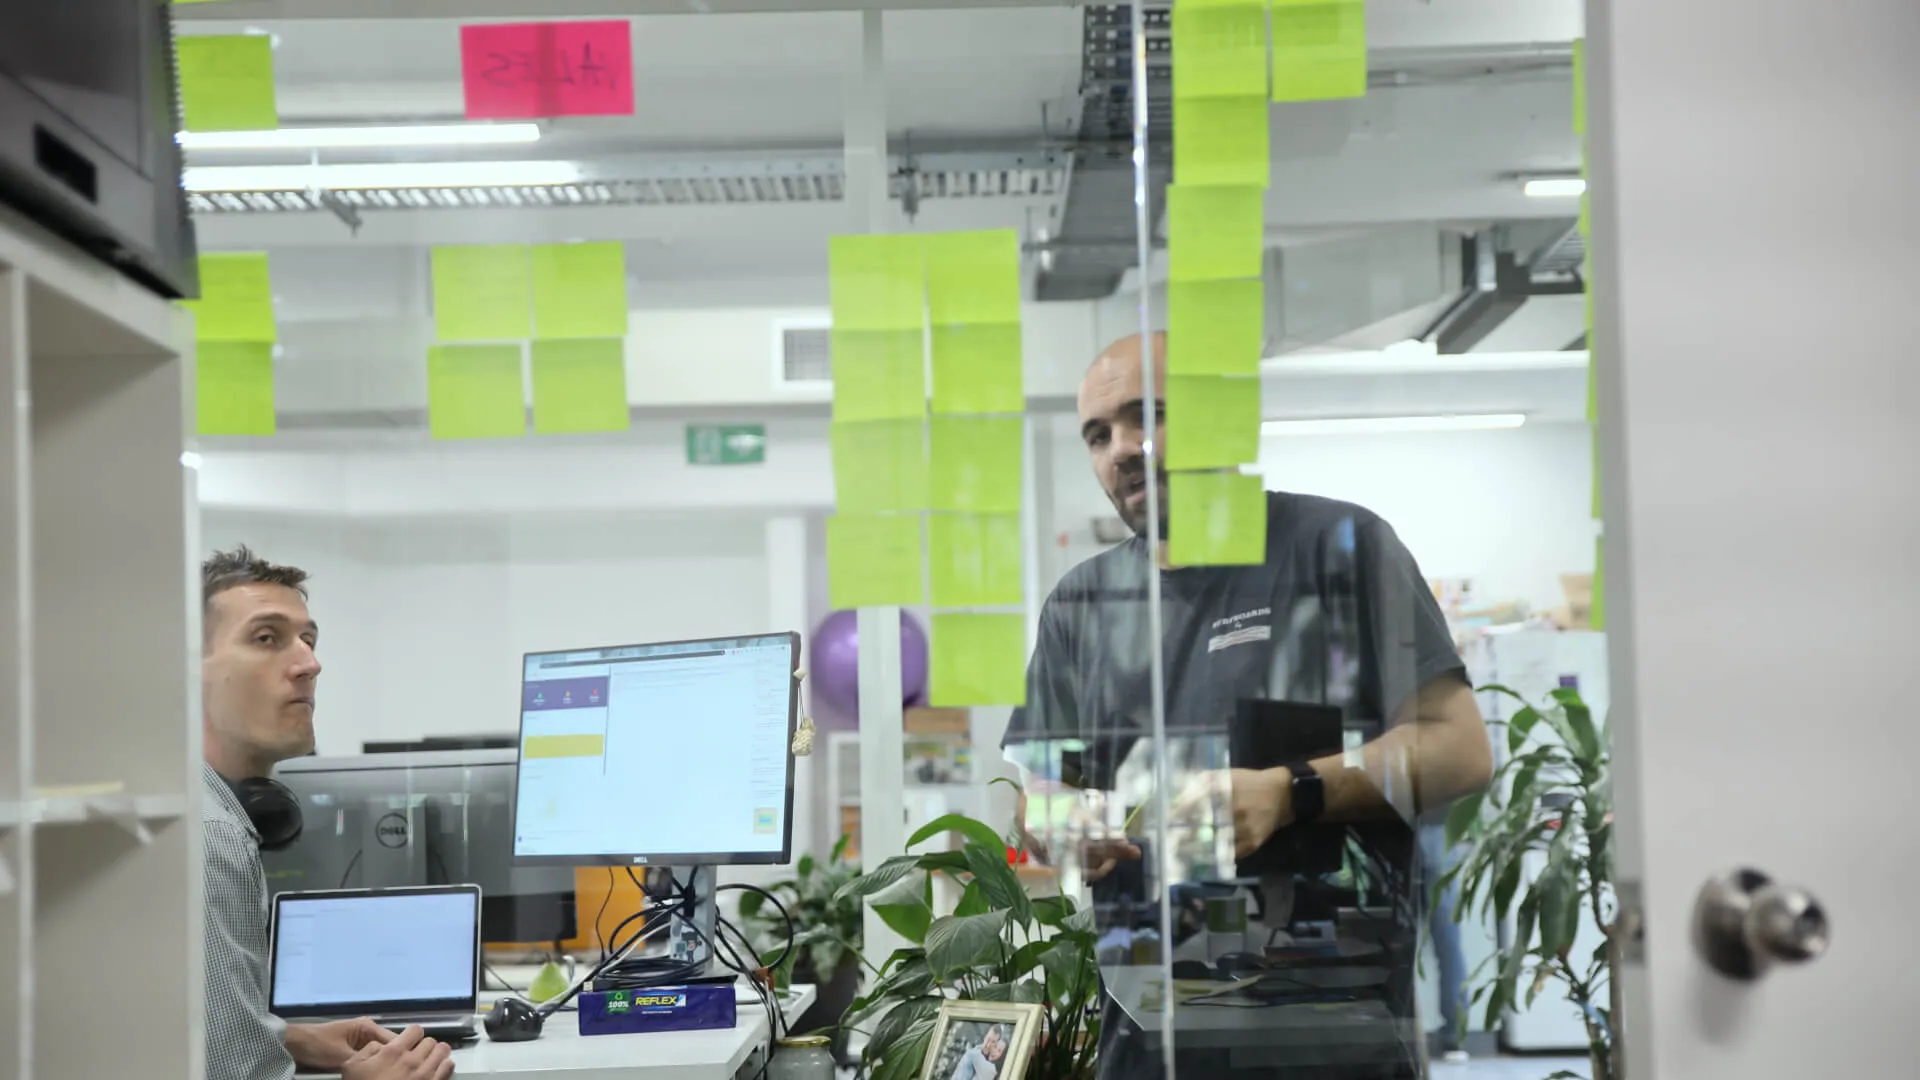
The next step was to have the interviews transcribed and uploaded into our user research platform. I used the following research methods to define the problem and group participants’ characteristics into personas.
- Empathy map
- Personas
- Affinity mapping
What we found at this define stage is that the responses fell into 3 main categories: economical, environmental and choice.
The economical factor was very important for most of the participants, as well as where their energy comes from — meaning, how much renewable energy they are getting. Although the choice factor was mentioned, it wasn’t as important as the other 2 categories.
03
One pixel at a time.
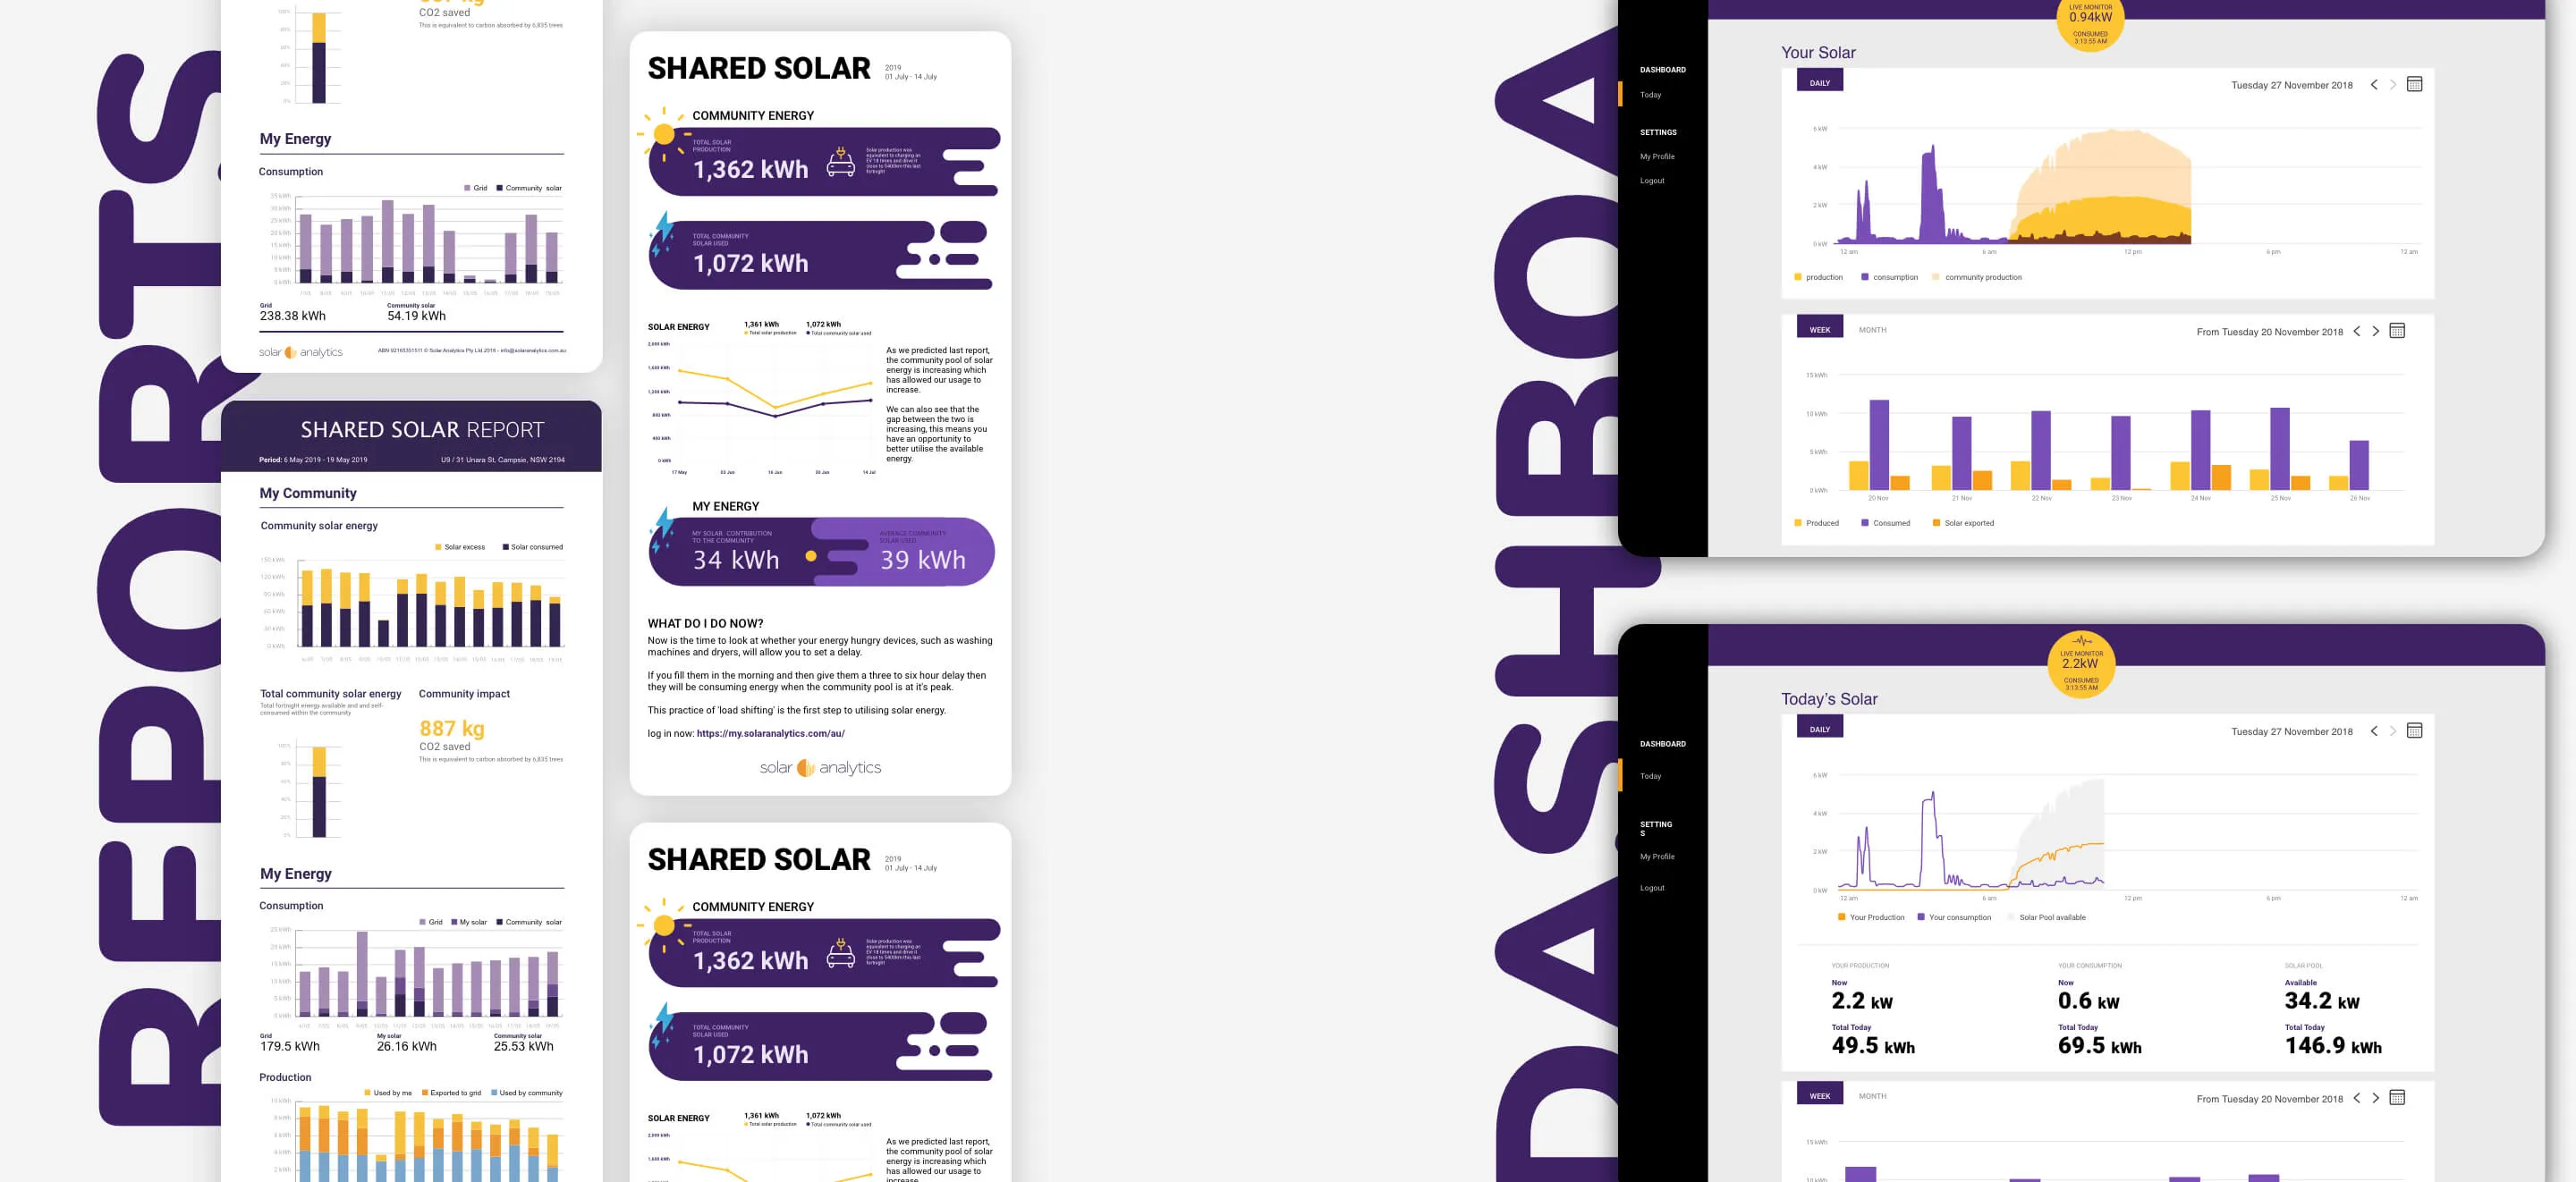
The deliverables for this project were to design a dashboard and a report that would be sent fortnightly during a trial. The trial would last 90 days, with the expectation of releasing it to some Solar Analytics users afterwards.
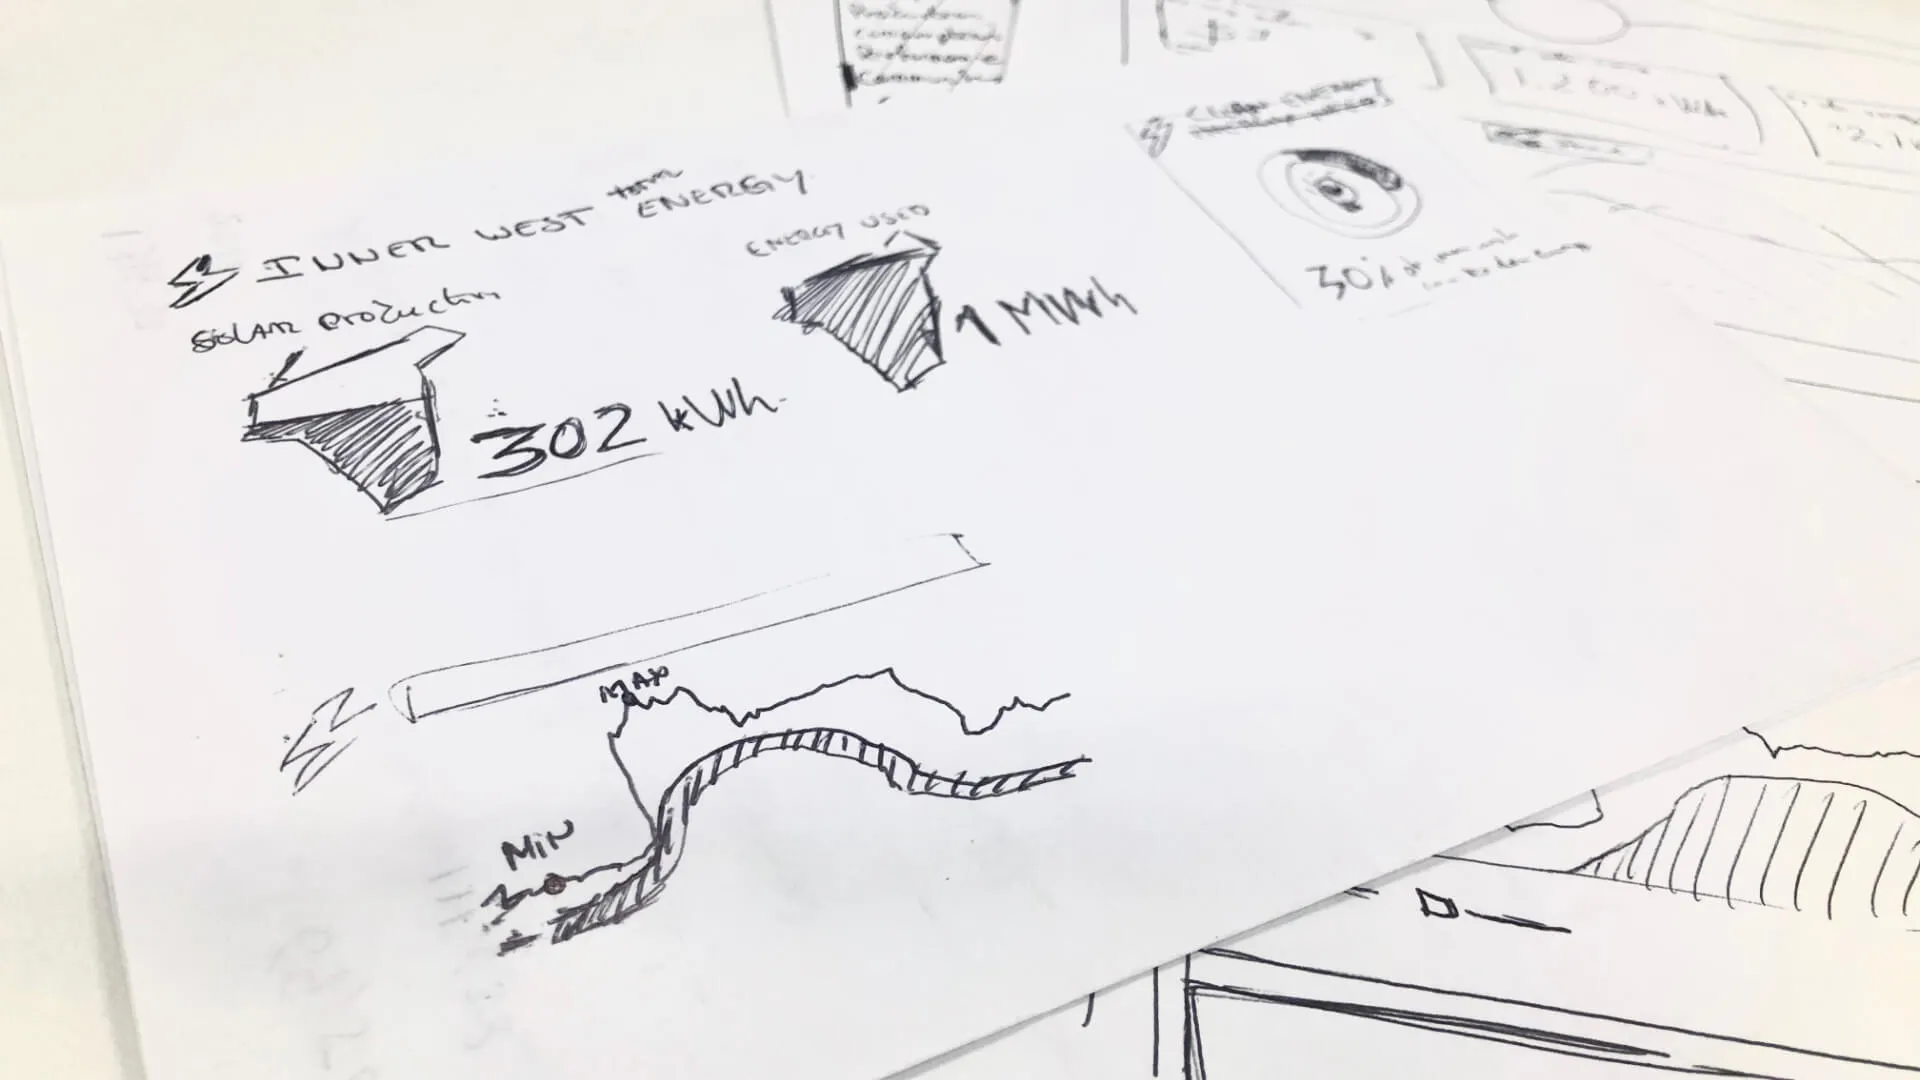
Sketch
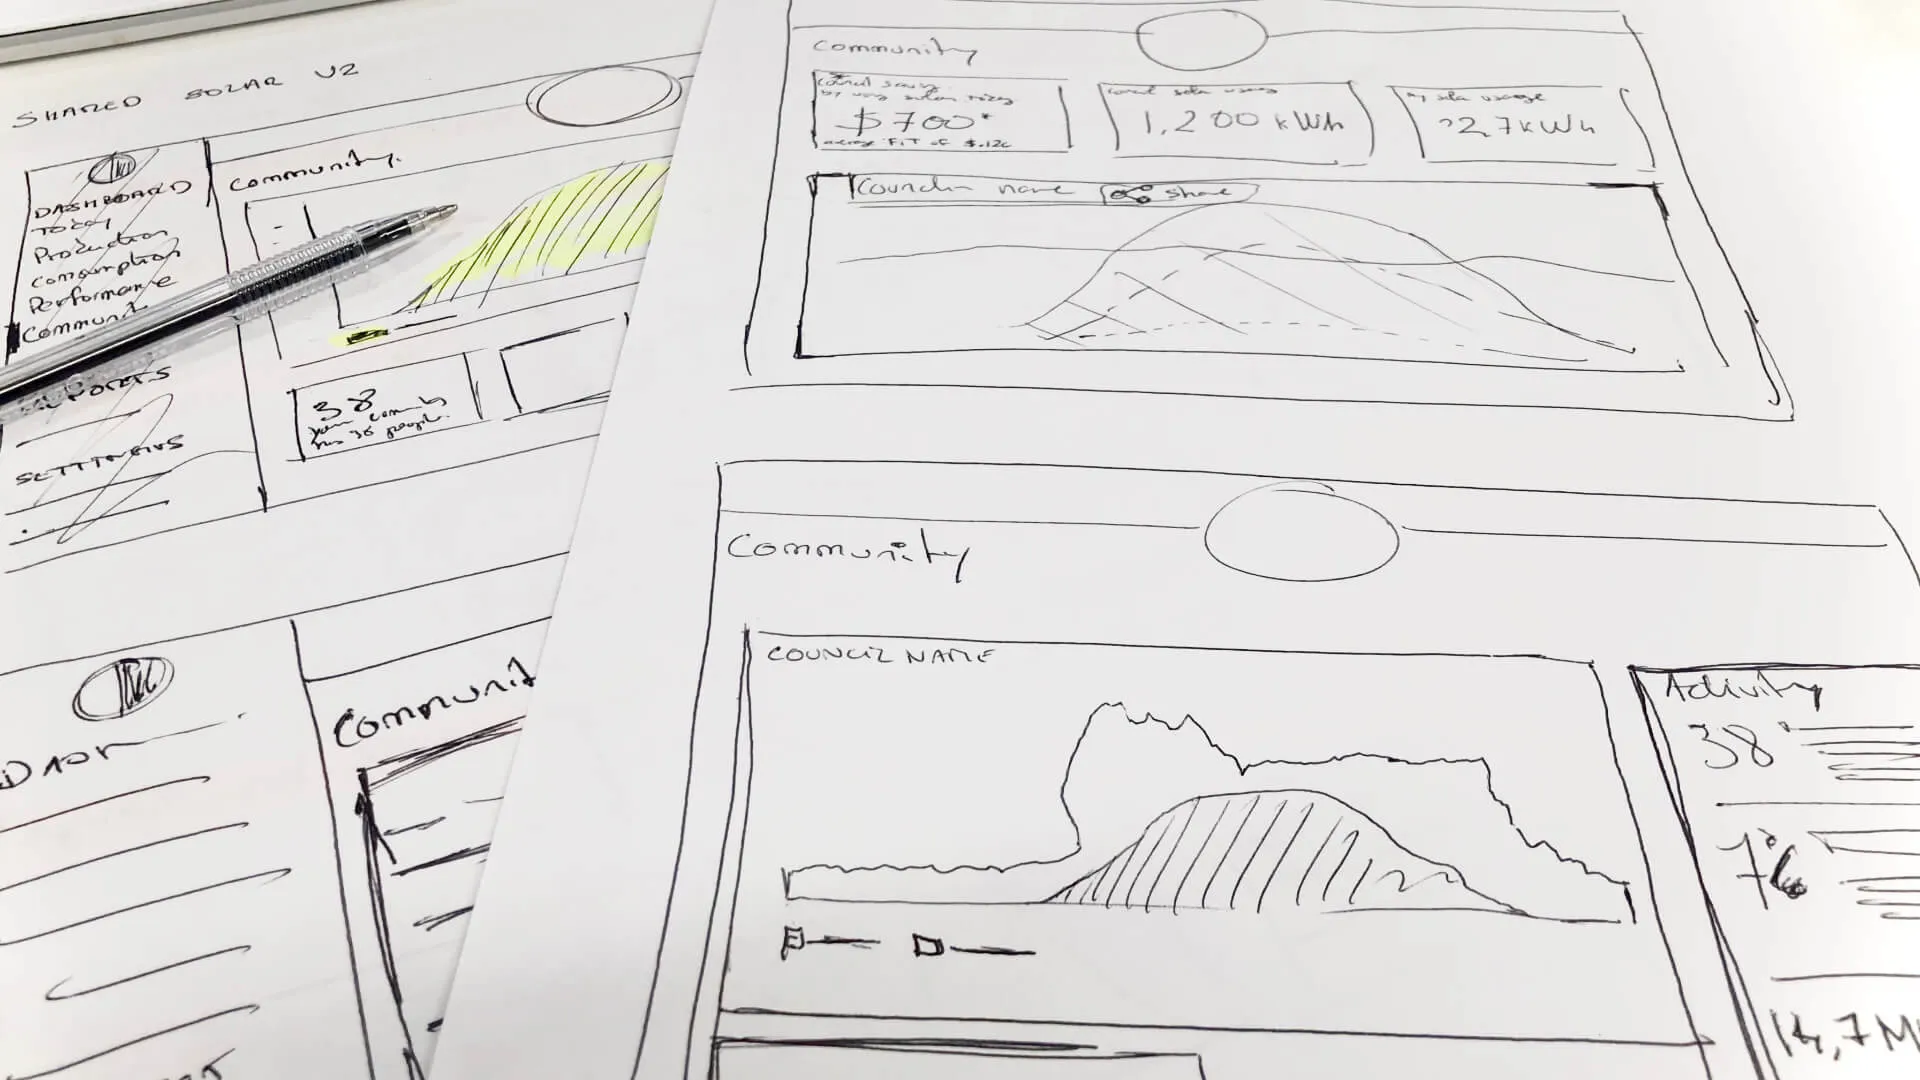
I started to sketch some layouts and dashboard components and present them internally before jumping into a hi-fi version.
Hi-fi wireframes
After having the wireframes approved, I polished them, applied visual elements and Solar Analytics branding, and used the design system I had put together.
I did another quick round of mockup testing with the participants before handing the designs and flows over to the developer.
04
Testing… Testing
Oh my god, that’s some funky stuff!
After having all the prerequisites checked, the 90-day trial started.
Usability testing
For this trial, we focused on testing the dashboard by doing usability testing. The feedback was positive and we made a couple of rounds of changes.
Diary studies
We decided to do a diary study for the report to understand what the participants wanted to see and how they would understand that information. The diary study lasted for the 90-day trial period.
05
Outcome
This has been a great project and I was very lucky to be part of it. Throughout this user research piece we learnt a lot and, overall, it was a good success.
- For the trial, it was the first time I used diary studies and it was very interesting. It definitely helped us understand how participants were using the dashboard and reports. The amount of information received was very valuable and made it possible for us to iterate and test faster.
- We saw that users needed better information and suggestions on what they should do next. We couldn’t just present numbers and charts.
- When designing, always use real data when possible. That was very important for us and, in a couple of scenarios, it helped us see possible problems that could happen at a later stage on the user dashboard.
- Know exactly what you want to know, or the type of information you want from these interviews. It would have helped me select different research methods that would have cut down the interview time by 40%, as well as data analysis and input by 30%.